Band broadening: there are many reasons for and it is important that these are understood and the phenomenon kept to a minimum so that the number of theoretical plates in the column is high.
First Cause: Eddy Diffusion
The column is packed with small stationary phase particles. The mobile phase passes through and transports the sample molecules with it (Figure 2.2). Some molecules are ‘fortunate’ and leave the column before most of the others, after having travelled by chance in roughly a straight line through the chromatographic bed. Other sample molecules leave later, having undergone several diversions along the way.


Second Cause: Flow Distribution
The mobile phase passes in a laminar flow between the stationary phase particles (Figure 2.3). The flow is faster in the ‘channel’ centre than it is near a particle. The arrows in Figure 2.3 represent mobile phase velocity vectors (the longer the arrow, the greater the local flow velocity). Eddy diffusion and flow distribution may be reduced by packing the column with evenly sized particles.
The first principle on which a good column is based is that the packing should be composed of particles with as narrow a size distribution as possible. The ratio between the largest and the smallest particle diameters should not exceed 2.0, 1.5 being even better (example: smallest particle size 5.0 mm, largest particle size 7.5 mm).
The broadening due to eddy diffusion and flow distribution is little affected, if at all, by the mobile phase flow velocity.


Third Cause: Sample Molecule Diffusion in the Mobile Phase
Sample molecules spread out in the solvent without any external influence (just as a sugar lump dissolves slowly in water even without being stirred). This is longitudinal diffusion (Figure 2.4) and has a disadvantageous effect on plate height only if:
(a) small stationary phase particles,
(b) too low a mobile phase velocity in relation to the particle diameter, and
(c) a relatively large sample diffusion coefficient coincide in the chromatographic system.
The second principle is that the mobile phase flow velocity should be selected so that longitudinal diffusion has no adverse effect. This applies when u > 2Dm/dp, where u is the linear flow velocity of the mobile phase, Dm the diffusion coefficient of the sample in the mobile phase and dp the particle diameter.
Fourth Cause: Mass Transfer between Mobile, ‘Stagnant Mobile’,
and Stationary Phases
Figure 2.5 shows the pore structure of a stationary phase particle: the channels are both narrow and wide, some pass right through the whole particle and others are closed off.


The pores are filled with mobile phase which does not move (it stagnates). A sample molecule entering a pore ceases to be transported by the solvent flux and changes its position by means of diffusion only. However, two possibilities present themselves:
(a) The molecule diffuses back to the mobile flux phase. This process takes time, during which molecules that have not been retained in the pores move on slightly further. The resulting band broadening is smaller the shorter are the pores, i.e. the smaller are the stationary phase particles. In addition, the diffusion rate of the sample molecules in a solvent is larger under lower viscosity conditions (i.e. they diffuse faster in and out of the pores) than it is in a more viscous medium.
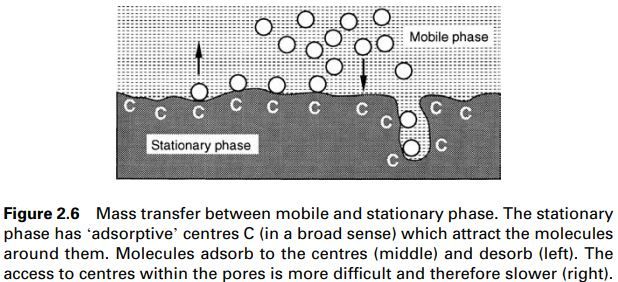
(b) The molecule interacts with the stationary phase itself (adsorbent orliquid film) and is adsorbed. For a while, it remains ‘stuck’ tothe stationary phase and then passes on once more. Again, this mass transfer takes a fair amount of time (Figure 2.6).
In both cases, band broadening increases with increasing mobile phase flow velocity: the sample molecules remaining in the moving solvent become further removed from the stagnant molecules the faster is the solvent flux (but less time for solute elution is necessary).
- The third principle is that small particles or those with a thin, porous surface layer should be used as the stationary phase.
- The fourth principle is that low-viscosity solvents should be used.
- The fifth principle is that high analysis speed is achieved at the expense of resolution and vice versa.
However, this effect is much less pronounced with smaller than with larger particles.
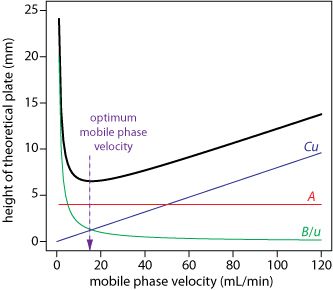
The theoretical plate height, H, can be expressed as a function of mobile phase flow velocity, uopt (Figure 2.7).1 The H/u curve is also called the van Deemter curve. The optimum flow rate uopt depends on the properties of the analyte.


Contributions to Band Broadening in Chromatography
One way to improve a separation is to decrease the height of a column’s theoretical plate. The figures here consider four contributions to plate height: variations in paths length, longitudinal diffusion, mass transfer in the stationary phase, and mass transfer in the mobile phase.
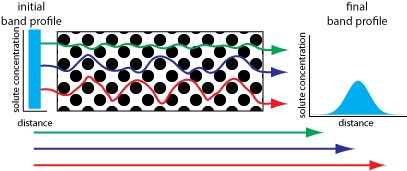
The effect of multiple paths on a solute’s band broadening is illustrated here. The solute’s initial band profile is rectangular. As this band travels through the column, individual solute molecules take different paths, three of which are shown by the meandering colored arrows. The actual lengths of these paths are shown by the straight arrows at the bottom of the figure. Most solute molecules travel paths with lengths similar to that shown in blue, with a few traveling much shorter paths (green) or much longer paths (red). As a result, the solute’s band profile at the end of the column is broader and Gaussian in shape.


The second contribution to band broadening is the result of the solute’s longitudinal diffusion in the mobile phase. Solute molecules are constantly in motion, diffusing from regions of higher solute concentration to regions where the concentration of solute is smaller. The result is an increase in the solute’s band width, as illustrated here by the two horizontal cross-sections through the column and their corresponding concentration versus distance profiles with (a) being earlier in time. The red arrow shows the direction in which the mobile phase is moving.


As the solute passes through the column it moves between the mobile phase and the stationary phase. We call this movement between phases mass transfer. As illustrated here, band broadening occurs if the solute’s movement within the mobile phase or within the stationary phase is not fast enough to maintain an equilibrium partitioning of solute between the two phases: (a) ideal equilibrium Gaussian profiles for the solute in the mobile phase and in the stationary phase; (b, c) the movement of the solute’s band with the mobile phase disrupts this equilibrium and, as indicated by the red arrows, the solute most from the stationary phase to the mobile phase and from the mobile phase to the stationary phase to reestablish equilibrium; (d) once equilibrium is reestablished, the solute’s band is now broader.


The height of a theoretical plate, H, is a summation of the contributions from each of the four contributions to band broadening. As shown here, H is a complicated function of the mobile phase’s flow rate, u,
H = A + B/u + Cu
which also is known as the van Deemter equation.


In the van Deemter equation, A accounts for the contribution of multiple paths, B/u for the contribution of longitudinal diffusion , and Cu for the combined contribution of mass transfer in the stationary phase and mobile phase.
