Liquid Chromatography Basics
Definition and primary classification of chromatography
According to IUPAC (1-4), we can define the process as "a physical method of separation in which the components of the sample to be separated are distributed in two phases, one of which remains stationary (stationary phase) while the other (the mobile phase) moves in a defined direction.
The stationary phase is one of the two phases that make up the chromatographic system. It can be a solid, a gel or a liquid. If it is a liquid, it can be distributed over a solid…
The Mobile Phase is a fluid that percolates through or along a stationary bed in a defined direction. It can be a liquid (liquid chromatography) or a gas (gas chromatography)".
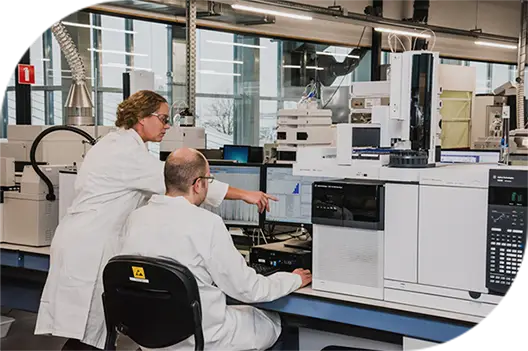
According to IUPAC, chromatography can be classified in several ways, according to the method, the shape of the stationary bed, the physical nature of the mobile phase and according to the mode of separation (see Figure 1.1.).
In relation to liquid chromatography (LC) on column, we can find LC with large particles operated by gravity or at low pressure, known as liquid chromatography on column, and LC with microparticles that require the use of pumps for the elution of the mobile phase. If the microparticles are larger than 2 μm it is possible to use an HPLC system, but if they are less than 2 μm it is necessary to use a UPLC or UHPLC system.
The classification according to the separation mechanism is somewhat more extensive and complex, including the following(1).
Method Designation |
Separation mechanism |
|---|---|
| Adsorption Chromatography | Difference in adsorption affinity between sample components and the active sites of the stationary phase. active sites of the stationary phase |
| Affinity Chromatography | Biological specificity of the analyte-ligand interaction |
| Countercurrent Chromatography (CCC) | Partitioning between two immiscible liquid phases with no solid support |
| Chiral or Enantioselective Chromatography | Separation by interaction with a chiral partner in the system, typically the stationary phase but can also be in the mobile phase. |
| Size Exclusion Chromatography (SEC) | Separation by exclusion (size and/or shape of the analyte) with calibration curves based on molecular weight. Depending on the mobile phase it can be GFC (aqueous) or GPC (organic). |
| Hydrodynamic Chromatography | Separation of macromolecules by mobile phase velocity difference between the axis and the the axis and the walls of the column |
| Interaction Chromatography Hydrophilic-HILIC | Partition/ion exchange in a normal phase column, using an organic mobile phase with a small proportion of water. with a small proportion of water |
| Interaction Chromatography Hydrophobic-HIC | Separation by interaction between hydrophobic sites of the stationary phase and hydrophobic sectors of the proteins that are exposed by the effect of ionic strength |
| Ion Exchange Chromatography | Separation by ion exchange between column functional groups and sample components. The exchange can be of anions or cations. |
| Ion Exclusion Chromatography | Particle exclusion and early elution of ionic components, while oppositely charged compounds are retained and eluted afterwards |
| Ion Pairing Chromatography | Partitioning of ionic pairs formed between the ionic analyte and an additive of opposite charge in an appropriate buffer. opposite charge, in an appropriate buffer |
| Ligand Exchange Chromatography | Separation based on the analyte's ability to form complexes with metals |
| Micellar Chromatography | Reversed-phase chromatography where the mobile phase contains a surfactant at a concentration higher than the critical micellar concentration |
| Normal Phase Chromatography | Separation where the stationary phase is more polar than the mobile phase |
| Partition Chromatography | Separation based on the difference in solubility of the sample components between the mobile and stationary phases. between the mobile phase and the stationary phase |
| Reversed Phase Chromatography | LC separation where the mobile phase is more polar than the stationary phase |
HPLC - UPLC - UHPLC
HPLC stands for High Performance Liquid Chromatography, which will be translated here as High Performance Liquid Chromatography, keeping that acronym. This denomination is preferred to others used in other media such as CLAP, high performance or high efficiency, also used by other sources. Nor will it be translated as High Pressure Liquid Chromatography as a reflection of the acronym first used by Csaba Horvath, pioneer of this science, for the simple reason that pressure is not a separation tool but the natural consequence of forcing the passage of a liquid through a column filled with macroparticles. A clearer fact but one that has led to some misunderstandings is the advent of UHPLC. Since "conventional" HPLC systems had come to dispense pressures up to 6000 psi, that pressure level became an industry standard. However, the evolution of particle chromatography to diameters smaller than 2 μm made it necessary to overcome that barrier. The first to do so was Waters Corp. who named the UPLC® system for "ultra performance liquid chromatography" and trademarked the name and acronym, preventing the use of this acronym by other instrumentation companies.
These systems can today reach pressures of up to 1500 atm or almost 22000 psi, and it is clear that the objective of their creation was simply to utilize the sub-2 particle created, for which it was necessary to increase the maximum working pressure and decrease as much as possible the dead volume of the system, reduce the cell volume and increase the response speed of the detector, essential factors in order not to lose the efficiency gained with the reduction of the particle size.
By managing to work at higher pressure, with particles of smaller diameter and therefore more efficient, it seems to have been interpreted that this modality was better, and therefore different from HPLC and worthy of another name. Faced with the novelty, the commercially disadvantaged competition initially opposed this modality, arguing lack of merit and physical risks to work at such high pressures, reinforcing the idea that it was another system. However, with the increasing diffusion of the method, and in view of the higher working speed, greater efficiency and lower solvent consumption, the development and general production of these instruments finally began, which were called UHPLC to avoid the use of an already registered name.
However, there had been a dent in the confidence of some users, the feeling that it really could be another method, and the consequence was the impossibility, in regulated fields, e.g., USP, EP, JP, to transfer procedures developed and validated in HPLC to UHPLC, simply because it would "be" another mode of separation. However, the columns, fillers and functionality of the fillers is the same, the mobile phase is the same, the separation mechanisms, the interpretation of chromatograms and calculations are the same. It was necessary to wait for the maturation of the system to be accepted, and for the equivalence to be experimentally proven, for procedure transfer to be possible, which resulted in the first harmonized document of the USP chromato-graphy chapter (5), EP and JP in 2017, where the transfer of methods from HPLC to UHPLC and vice versa in regulated environments was proposed. This does not detract of course, that official methods should be verified before implementation as prescribed by USP (6), FDA (7),ISO(8) and AOAC (9), whether they have been transferred to UHPLC or not. The most important concept is the conclusion that both modalities are equivalent, and that official procedures can be scaled up, verified and used as originally validated, without loss of "official" status.
The mechanism of separation
Going back to the IUPAC definition, "Chromatography is a physical method of separation in which the components of the sample to be separated are distributed in two phases…".
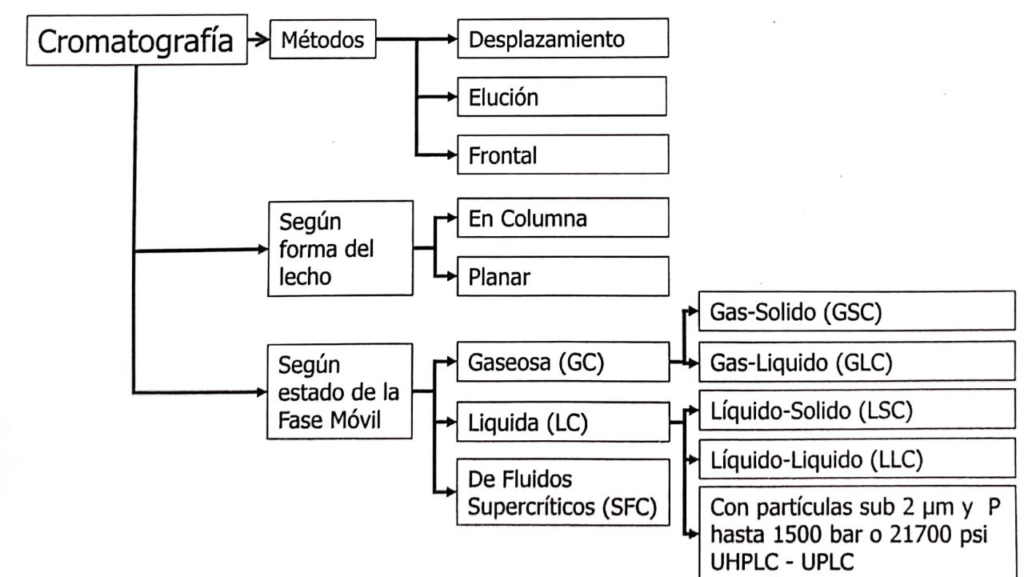
So we must evaluate a three-component system, the sample, the stationary phase and the mobile phase. In Figure 1.2, the sample has three components, each of which has a different chemical structure, characterized by the presence of functional groups that identify it, for example, phenolic or alcoholic hydroxyl groups, primary or secondary amines, aldehydes, ketones, etc. In turn, the mobile phase and the stationary phase have their own functional groups, which give them affinity for complementary functional groups (see Figure 1.1).
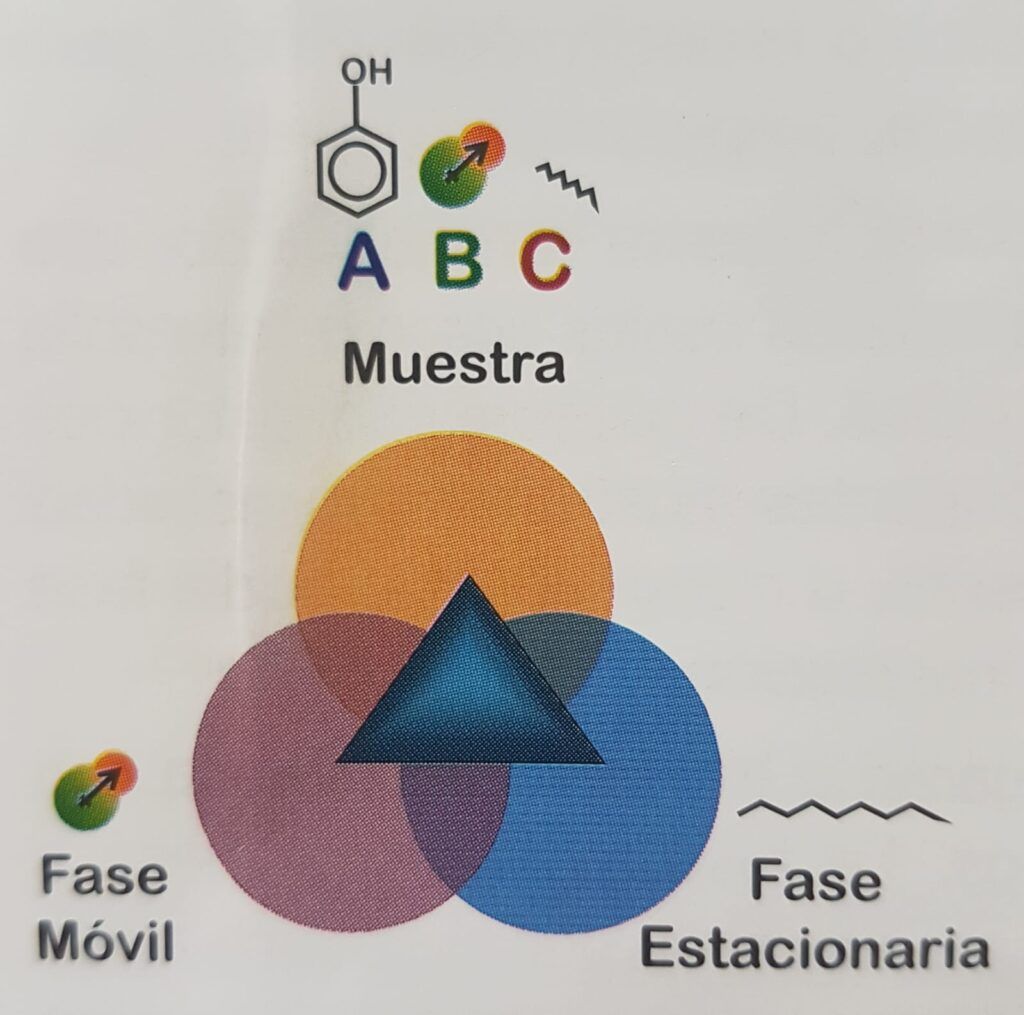
There are several interactions that model the affinity between molecules. One of the most important is the hydrogen bridge, where a hydrogen atom is covalently bonded to an electronegative atom in a proton-donating molecule that exposes it. In the surroundings it can find a proton acceptor molecule with another electronegative atom, eager for that proton which it attracts, but cannot take it because it is covalently bound to the first molecule. This interaction is widespread in nature, for example, between carbonyl and amino groups in proteins to form their three-dimensional structure, between complementary bases of DNA, between water and the hydroxyl of an alcohol, or a carbonyl, etc.
Other interactions include electrostatic interactions between anions and cations, hydrophobic and hydrophilic interactions that make it difficult to mix oil and water that clump together, steric interactions that make it difficult for a molecule to enter the bound phase due to steric hindrance, due simply to the size of the analyte, the weak London forces produced by the temporary dipoles created in each atom by the movement of its electrons, the dipole interactions produced by molecules of permanent polarity such as acetonitrile, among other retention forces (Figure 1. 3).
In chromatographic separation (Figure 1.4), the stationary phase contained in a column is equilibrated with a constant flow of mobile phase. The column outlet is connected to a monitoring device that measures some physicochemical property of the eluting liquid, in the case of the figure a photometric or spectrophotometric detector, but it can be a conductivity, fluorescence, amperometric detector, etc.
Once the system is equilibrated, the sample is injected, consisting of a solution containing various components, which travel through the column transported by the mobile phase. According to the chemical functionality, each of the components will show higher affinity for the mobile phase and elute faster, or higher affinity for the stationary phase and will be retained according to this interaction.
As a result, the components will travel through the column with different velocity and will be separated. The eluted mobile phase passes through a flow cell where it is monitored by the appropriate system, in this case a beam of light passing through the flow cell to find a photocell, sensitive to the change in light transmission/absorption. The mobile phase continues on its way and the signal from the photocell, proportional to the instantaneous absorption of the eluate passing through the cell, is transmitted to a chart recorder or to a data recording and processing system on a computer. The result is a chromatogram, a representation of the signal generated by the photocell as a function of time (see Figures 1.7 a and b).
The chromatogram then shows the separation of the components of the injected solution in a plot of the signal acquired by the detector (mV) as a function of time (minutes). The retention time (taken as the peak apex elution time), is a consequence of the chemical structure and functionality, and is therefore a primary function of the identity of the component. The retention time of A primarily identifies compound A as a component of the injected solution, as well as B and C. The intensity of the signal, measured as peak height or area under the curve, is a primary function of concentration.

Since it is not possible to know a priori the retention time or the response of the solute, it is necessary to have an appropriate reference standard of the material. For this purpose, a solution of known concentration of the standard is injected, and the system is calibrated to assign the identity of the component based on its retention time, and a response factor is calculated that relates the intensity of the signal to the concentration of the standard. Then when the sample is injected, the target component (identical to the standard) is identified by the retention time and its concentration by the response factor estimated for the standard.
The uncertainty principle related to the identity should be mentioned here. While it is clear that the identity of components A, B and C is a function of retention time, it is also clear that in nature there are surely tens or hundreds of compounds that will elute with a retention time similar to or indistinguishable from the retention time of the target component. In the case of the figure, there may be hundreds of compounds that elute in a 10 minute run. So, the validity of the first assertion, identity, will be more reliable in settings where the variability of components is not very high, for example, in an industry that handles a few tens of materials to produce a few products. As diversity expands, there will be a need for identity confirmation tools, e.g., by structural analysis (simultaneous spectroscopic analysis, peak purity analysis, molecular weight) to maintain control over the validity of the result. And there will be cases where the diversity is absolutely complex, as in the case of bioanalytical tests where the biological matrices provide a very high number of potential interferents, or in an environmental screening, or in the analysis of some structure in naturally complex matrices such as fruits or plant extracts. In these cases it may be absolutely necessary to have very selective detectors, such as mass-mass or time-of-flight couplings.
In relation to concentration-related uncertainty, it is clear that a correlation must be sought between the response and the concentration of the standard in the system used, and that the response of the analyte must be interpolated on that calibration curve, in a qualified system, using a validated procedure.
The Chromatographic System
Figure 1.5 shows schematically the simplest version of an HPLC system. At least a mobile phase reservoir, pump, injector, column and detector, with associated tubing and junctions, are required. The detector should minimally be connected to an XY chart recorder, although modern analysis encourages the use of a computer to act as a data acquisition, storage and processing system.

Although this basic scheme may be sufficient for a large number of applications, its expansion to more complex systems is inevitable due to the need for optimization and automation (see Figure 1.6). Thus, for example, the reliability of instrumental analysis relies heavily on statistical analysis, which promotes the processing of replicates to calculate uncertainty, leading to the desirability of automatic injectors, which in turn allow optimization of time and resources.
Then, it is sometimes necessary to use elution gradients, which allows the use of multiple solvents to prepare the mobile phase in situ, which pass through on-line degassers before reaching the pump. The gradient can be formed using one or two pumps.
It is then possible and sometimes convenient to use a column oven to house one or more chromatographic columns. The system can be programmed to use the first, wash it, condition the second, then use and wash it and shut down the system when finished, all without the need for analyst operation. The diversity of analytes may necessitate the use of more than one detector, and the column eluate need not necessarily be discarded, but the separate components can be collected by appropriate systems.

| Chromatogram | System suitability test |
|
| Material | Standard solution 1018 | Source: QA Laboratory |
| Analyst | FQ-SR | Vial: 1 |
| Date: | 07/26/2022 | Time: 12:19:46 |


Brief History of Liquid Chromatography
What follows are brush strokes of the historical development of liquid chromatography and HPLC that were taken from articles published by renowned chromatography researchers. It is not intended to be an exhaustive or complete description of the development of chromatography and is surely unfair to many researchers whose contribution was fundamental to this essential technique in virtually all modern sciences, but reading it may help to understand the mechanisms, and perhaps to improve current processes. Many of the events cited may briefly show the origin and some milestones that allowed us to get here(11-17).
The beginning cannot exclude the invention of chromatography, which we owe to Mikhail Semyonovich Tsweet who developed it in 1900. Tsweet was born in 1872 in Asti, Italy, the son of an Italian mother and a Russian officer. At a young age he moved to Switzerland where he graduated and took up botany. He then followed his father when he was called back to Russia and settled in St. Petersburg. He had to revalidate his degrees in Moscow, where he pursued academic activities, as well as in Warsaw and Lithuania. He first used the name Chromatography in his publications in 1906 (see Figure 1.8). In his work he filled glass tubes with a solid, in the case of the figure with calcium carbonate and equilibrated it with a liquid, carbon disulfide. After introducing chlorophylls in solution at the upper end, he eluted the liquid through the column, whereupon the pigments separated in the column, revealing a sequence of colored bands. At that time he created the name chromatography, from the Greek chroma (color) and grapho (writing), that is, writing in color.

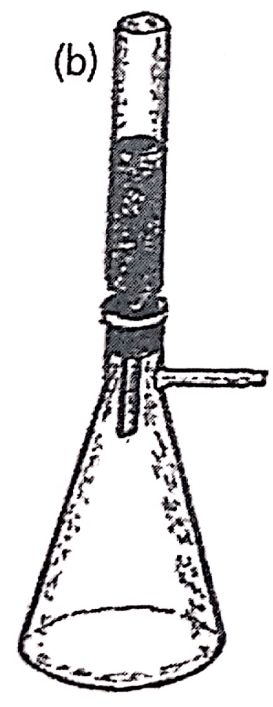

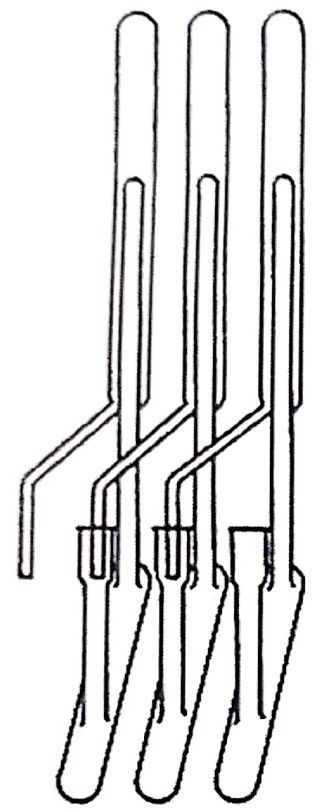
Figure 1.8. Drawings of the article published in 1906 by Tsweet. It includes in (a) an apparatus with five simultaneous columns with a mercury manometer and a rubber bulb for dispensing the mobile phase. It also shows in (b) a funnel-type column 2-3 mm in diameter and 20-30 cm in length mounted on a Kitasate and in (c) a chromatographic separation of pigments, using carbon carbon carbonate as the stationary phase and carbon disulfide as the mobile phase.Reproduced with permission from LC-GC.
In reality, the sample components were not eluted from the column as we do today, but formed a color pattern within the column representing the composition of the chlorophylls. The method had great repercussion, but naturally it had great limitations as it could not visualize colorless components, and did not allow the elution of the components of the column.
Thin layer chromatography (TLC) presented a solution to this problem.TLC could be considered as an open column chromatography, so that by accessing the material, specific or universal development could be carried out as required. For example, the application of a ninhydrin spray followed by heat reveals the colorless amino acids, which turn blue. Iodine vapors, when the dry plate is exposed to its vapors after the run, fix on organic compounds with double or triple bonds, giving them a reddish-brown color. And the simple spraying of sulfuric acid followed by heating in an oven at 100°℃ carbonizes the organic compounds which are visualized as dark spots on the white plate.
HPTLC of chamomile oil, different disclosures
UV 254 nm with and without filter
UV 366 nm Post derivatization
Anisaldehyde drifting Reflactance R+T Transm.

One of the first precursors of this technique was Edgar Lederer and it had more recent advances with Egon Stahl. The impact of TLC was immediate, and due to its simplicity and low cost it quickly gained ground in the field of analytical chemistry. At the time of the wider diffusion of liquid and gas chromatography, TLC continued to develop in Eastern Europe. It is still used today, although with much less diffusion due to the advance of HPLC.
Shortly after, liquid chromatography (LC) had a very significant breakthrough in the 1940s when Archer J.P. Martin and Richard L.M. Synge created partition chromatography or liquid-liquid chromatography (LLC), as opposed to the liquid-solid chromatography (LSC) that predominated at that time, and such was the impact of this development that they received the 1952 Nobel Prize in Chemistry for it.
Martin was doing research on vitamin E at Dunn Nutritional Laboratory, and was experimenting with the separation of carotenes heterogeneous phases. He had constructed for this purpose a system of 45 chained tubes that served as decanting ampoules, separated by 90 valves that prevented the return of the liquid to the previous ampoule. The scheme of his apparatus was not published.
Synge on his part investigated the amino acids of wool in IWS, and the method employed consisted of acetylating the amino acids to extract them in chloroform. He noted with enthusiasm the difference in the chloroform-water partition coefficients of the acetylated amino acids, which presented promising prospects for liquid-liquid extraction, and for this he was contacted by Martin, who was very experienced in countercurrent distribution and had developed an apparatus that had made him well known in Cambridge. Shortly afterwards they found themselves working at the Wool Research Association in Leeds, UK, where they had to create another apparatus because the one they had was not compatible with the water-chloroform system. The new continuous flow apparatus had 39 "theoretical plates" (Figure 1.10 represents a system devised by Lyman Craig in the '40s (18) not necessarily identical to Martin's system, but showing a countercurrent extraction train used in those years).

It was reportedly a complicated system, which had to be attended by two operators in 4-hour cycles, lulled to sleep by chloroform vapors. The results were not very satisfactory, and Martin and Synge tried to improve the system by creating variants. An intermediate system was a glass tube with the wool and cotton fibers oriented in the direction of the tube, with the chloroform moving in one direction and the water in the opposite direction. Neither worked as expected until finally Martin thought that it was not necessary to move the two liquids, that one could be left stationary in a column and move the other.
To achieve this purpose they impregnated the silica gel they used as a desiccant in the balance with water and with this material they packed a glass column, added the acetylated amino acid mixture and poured chloroform into the inlet, perhaps as in the schematic in Figure 1.11). The addition of methyl orange allowed them to follow the path of the amino acids through the column. It may sound very simple today, but it was certainly hard work to properly prepare the stationary phase (water) on a support that had not been fabricated for that purpose (silica gel) and to properly prepare the mobile phase (chloroform) in a reproducible way. Martin developed in parallel the theory of chromatography based on distillation concepts, and the paper was submitted in two parts in November 1941 to the Biochemical Journal, and published in December 1941 as A New Form of Chromatography Employing Two Liquid Phases (19-20).
Shortly thereafter Synge left the group to investigate amino acids in antibiotics, and was the first to elucidate the sequence in a polypeptide using paper chromatography.
Martin joined the Medical Research Council in 1948 and became involved in the analysis of fatty acids by chromatography. As his system had a polar stationary phase and a poorly polar mobile phase (water and chloroform), the partition coefficients did not favor it, so he decided to develop a hydrophobic stationary phase to retain the fatty acids. He achieved this with Howard (20) by treating kieselguhr (diatomaceous earth) with dimethyl dichlorosilane (see Figure 1.12).
Unlike the liquid-liquid partition chromatography developed in '41 where the attachment of the liquid to the stationary phase was a simple mechanical retention in the pores and therefore unstable, this reaction bound the silanizing molecule to the support by covalent bonding, leaving the nonpolar liquid (dimethylsilane) as the hydrophobic stationary phase, immiscible with the polar solvent of the mobile phase. Martin used this system to separate lauric acid from stearic acid by partitioning.

On the other hand, Martin had predicted the use of a gaseous mobile phase in 1941, but did not develop the idea until 1950 when he brought the silanized stationary phase to GC, publishing the method as gas-liquid partition chromatography in October 1950. This method proved its usefulness in a short time and was the basis for the development of gas-liquid chromatography (GLC).
Within a short time this material migrated back to liquid chromatography and was first used in 1967 by Aue and Hasting at Dalhouise University in Nova Scotia, but probably the first commercialized filler material using reversed phase was developed in 1972 by Kirkland at Dupont. This material was called Permaphase ODS, was of the pellicular type and consisted of 35 um diameter microspheres with a thin stationary layer of silica gel attached to octadecylsilane, totaling a spherical particle of about 50 um diameter. Prior to this, in 1966-1967 Csaba Horvath noted that the working pressure needed was greater than 1000 psi, and thinking that this technology deserved a new name he was the first to use the four letters we know today, HPLC(21).
In 1972, Majors developed at Varian the microparticle material of 10 μm silica gel bonded to ODS. This material was called MicroPak-CH. Shortly thereafter, in 1973 Csaba Horvath baptized the method as Reverse Phase.
In retrospect, the relatively limited diffusion of liquid-liquid partition chromatography may be striking today, although we can see that important causes for this were due to the quality of the support, not yet designed for these purposes, the difficulty in keeping the stationary phase stable on the solid support and the preparation of the mobile phase. Probably for this reason IUPAC published in 1972 an article stating that "the reversed phase is only a technique of historical interest"; however, the covalent bonding of a liquid to the supporting solid was another fundamental fact that led to the development of modern stationary phases, having the physical characteristics of a solid, but containing an interface liquid with stable bonding.
We can say that in the early 1970s HPLC was born, with the development of columns filled with efficient macroparticles and systems that allowed the elution of the mobile phase by the use of pumps and high pressure. As indicated above, the first particles used were of the pellicular type, consisting of small glass spheres of about 35 μm coated with a thin layer of silica gel covalently bonded to octadecylsilane (ODS or C18), resulting in a particle of about 50 μm.
Shortly thereafter, fully porous macroparticles of 10 μm in diameter were developed, and the supply of stationary phases of different functionality was diversified, but this will be developed in more detail in the following pages.
Here you can see the Post in Spanish: Cromatografia
References
A. Wikipedia: https://en.wikipedia.org/wiki/High-performance_liquid_chromatography
B. Knauer: https://www.knauer.net/en/search?q=chromatography
C. Kromasil: https://www.kromasil.com/support/faq.php
D. Shimadzu: https://www.shimadzu.com/an/service-support/technical-support/analysis-basics/basic/what_is_hplc.html
E. ChemistryView: https://www.chemistryviews.org/details/education/9464911/What_is_HPLC/
1. Tatiana A. Maryutina et al., Terminology of separation methods (IUPAC Recommendations 2017), Pure Appl. Chem.2018; 90 (1): 181-231.
2.United States Pharmacopeia. USP 41-NF 36. Rockville, MD:United States Pharmacopeial Convention;2018.
3. Nomenclature for chromatography.L.S.Ettre, Pure & Appl,Chem., Vol.65,No. 4, pp. 819-872, 1993.
4.Standard definitions of terms relating to mass spectrometry,K Murray et al., IUPAC, Anal. Chem. División, MS Terms Third Draft, August 2006.
5. Nomenclature in evaluation of Analytical methods including detec-tion and quantification capabilities, L Currie, Pure &Appl.Chem., Vol.67,No.10, pp.1699-1723,1995.
6. United States Pharmacopeial Forum 43 (5), Harmonization Stage 4: <621> Chromatography,Rockville, MD:United States Pharmaco-peial Convention US, September 2017.
7. United States Pharmacopeia <1224> Verification of Analytical Pro-cedures, USP 41-NF 36. Rockville,MD:United States Pharmacopeial Convention;2018.
8.ISO/IEC 17025:2017,General requirements for the competence of testing and calibration laboratories, section 5.4.2.
9. CFR 211.194 (a)(2),Laboratory Records.
10.How to meet ISO 17025 Requirements for Method Verification. ALACC Guide 2007,AOAC International 481 N.Frederick Ave,Suite 500, Gaithersburg, MD 20877,USA.
11. Milestones in Chromatography, The Birth of Partition Chromatogra-phy,Leslie S.Ettre, LCGC 19,506-512, Number 5 MAY 2001.
12.Csaba Horvath and the Development of the First Modern High-Performance Liquid Chromatograph, L.Ettree,LCGC North America, May 01,2005.
13. Developments in HPLC Column Packing Design,Ronald Majors, LCGC,LC column technology supplement pp 8-15, APRIL 2006.
14. The History of Chromatography, The early days of HPLC at Dupont, R.Henry,LCGC North America, Volume 27, Number 2, pp 146-153, February 2009.
15. History of Chromatography, Joseph Jack Kirkland: HPLC particle Pioneer, LC·GC Europe, pp. 438, 443,August 2013.
16. Chapters in the Evolution of Chromatography, L. Ettree, ed. By J. Hinshaw,Imperial College Press,2008,World Scientific Publishing Co.Pte.Ltd.
17.HPLC,Advances and Perspectives vol. 1, Ed. By Czaba Horvath, Academic press,1980.
18. Apparatus for Countercurrent Distribution,Lyman C. Craig, Otto Post, Anal. Chem. 21,500, 1949.
19. A.J.P.Martin and R.L.M.Synge,Biochem.J.35,91(1941).
20. A.J.P. Martin and R.L.M.Synge,Biochem.J.35,1358-1368(1941).
21.A.J.P.Martin and Howard,Biochem.J.46,532(1950)-LL partition paraffin oil and n-octane on diatomaceous earth.